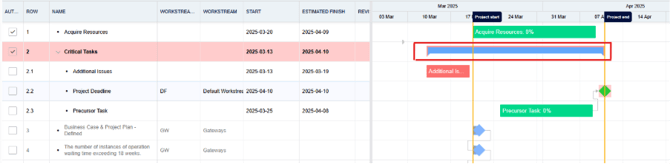
The Gantt Chart consists of two key areas:
-
Left-hand side: A data table listing all Summary Tasks, Milestones, and Tasks.
-
Right-hand side: A visual timeline where Summary Tasks appear as blue bars with endpoints, Milestones as diamond shapes, and Tasks as horizontal bars displaying the task name and percentage complete.
Date and Scheduling Logic
The Gantt automatically determines the end date for each Task or Milestone based on the following hierarchy:
-
If Revised and Completion dates are blank, the chart uses Estimated Finish.
-
If a Revised date is entered (and Completion is blank), the Gantt takes the Revised date and updates the Estimated Finish accordingly.
-
If a Completion date exists, it updates the Estimated End and a book icon appears on the Gantt timeline to mark the revised date.
Summary Task start and end dates are derived from the earliest start and latest end dates of their child items. If there are no children, the system uses the plan start and end dates.
Dependencies
Dependencies are displayed as arrows connecting source and dependent Tasks or Milestones. The Gantt supports standard dependency logic, allowing for the creation of relationships between items to determine scheduling flow.
You can also apply lag between dependencies to add time gaps between linked items.
Colour Coding
-
Summary Tasks are always displayed in blue for clarity.
-
Milestone diamonds and Task bars are coloured according to their Delivery Status (RAG status).
Table and Columns
The Gantt table is split into two areas:
-
Fixed columns: Always visible during horizontal scrolling.
-
Main table area: Scrolls horizontally as expected.
Right-clicking a column header opens a context menu where you can:
-
Add or remove a column from the fixed area.
-
Sort or hide columns.
-
Re-show hidden columns using the Columns option in the context menu, where all available columns (including new additions such as Effort Driven) can be toggled via checkboxes.
Toolbar and Display Controls
Between the table and the plan tab buttons, a toolbar allows you to customise your view and actions:
-
Export the Gantt to
.xlsx,.csv, or.pdfformats. -
Indent/Outdent rows to create or remove Summary Tasks.
-
Expand/Collapse all Summary Tasks.
-
Adjust Timeframe from a 5-year overview to half-hour intervals.
-
Reset View to restore default columns, sizes, and fixed column layout.
-
Undo/Redo actions (available in manual save mode).
Drag-and-Drop Interaction
The Gantt supports flexible drag-and-drop functionality:
-
Vertical drag: Reorder Tasks and Milestones within the table.
-
Horizontal drag: Reschedule Tasks and Milestones directly on the timeline.
-
Resize: Adjust Task durations by dragging start or end points.
Critical Path
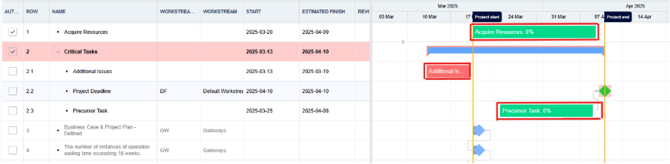
The Gantt highlights the Critical Path in light red, both on the timeline and within the Task/Milestone bars.
This path is calculated using the Critical Path Method (CPM), tracing backward from the final task or milestone to identify all dependent activities essential to the project’s completion.
Accessibility
The Gantt adheres to WCAG accessibility guidelines, ensuring proper colour contrast, logical keyboard navigation, and visible focus indicators.
Row Types
Summary Tasks
-
Can contain child items (Summary Tasks, Milestones, or Tasks).
-
Dates are automatically determined by the earliest start and latest end of their children.
-
Can have dependencies and be edited from the Task Edit popup.
-
Always displayed in blue for clear identification.
-
Deleting a Summary Task will also delete all its children—move or outdent any items you wish to keep beforehand.
-
If all children are removed or out-dented, the Summary Task will convert back into a regular Task.
Milestones
-
Represent a single date rather than a duration.
-
Cannot have duration or start date edited.
-
Cannot have resources assigned.
-
May include Revised or Completion dates.
-
Can have dependencies applied.
-
Displayed as diamonds on the Gantt timeline.
-
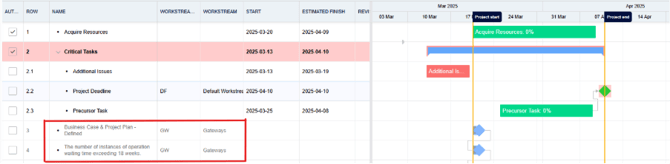
Gateway Milestones are defined sitewide by a local admin and appear greyed out. These can only be edited for dates and dependencies.
Tasks
-
Have both start and end dates.
-
Can be assigned resources via the Resources tab in the Task Edit popup (these also appear on the Plan → Resources page).
-
Support dependencies and effort-driven scheduling.
-
Can be displayed as part of the Critical Path (highlighted with a pink outline).
-
Tasks can be set as Effort Driven, where duration and end date are determined by effort input (in Hours or Days).
-
Example: For a 7.5-hour workday, 10 hours of effort equals 2 days duration.
-
-
Tasks turn red when overdue, matching their Delivery Status colour.
Auto-Scheduling
Tasks and Milestones can be set to Auto-Schedule Mode, allowing PM3 to automatically calculate dates based on dependencies and constraints.
If no dependencies are present, the system defaults the start date to the project’s start date.
Auto-scheduling can be enabled:
-
In the left-most column of the Gantt table, or
-
Within the Advanced tab of the Task Edit popup.
Dependencies and relationships can be reviewed directly on the Gantt or within the Successor and Predecessor tabs in the Task Edit popup.
Summary
The Gantt Chart offers a faster, more intuitive, and accessible experience for project planning, combining advanced dependency management, visual clarity and interactive control all while maintaining compatibility with familiar PM3 planning principles.